Bitcoin fails to flip the weekly open, and the retest sends it to $63.7K
Price came back to the $65,399 weekly open during the New York session, was rejected below it, and slid to test last week’s low. A textbook retest — and a lower-timeframe trend shift.
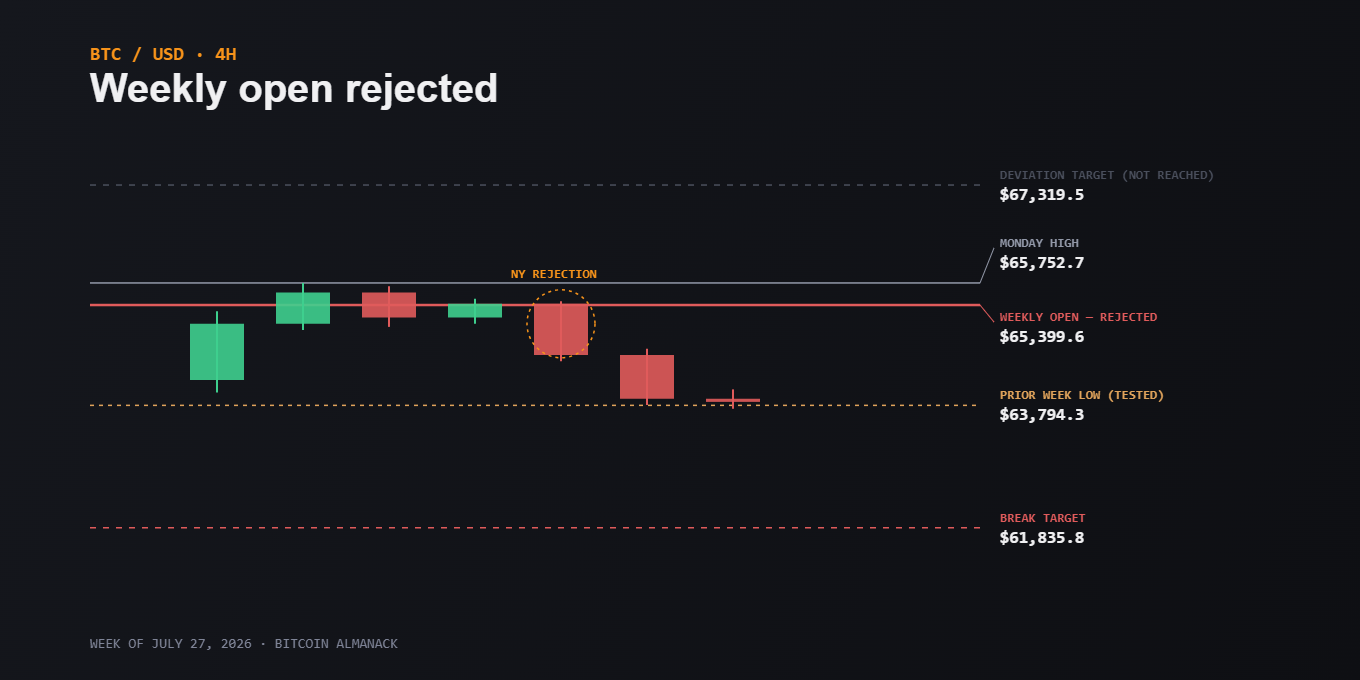
The weekly open at $65,399.6 held as resistance on the retest. Chart: Bitcoin Almanack.
Bitcoin spent Tuesday trying to get back above one number and failed at it. The weekly open — $65,399.6, where this week's candle started — was reclaimed briefly, then lost. Price came back to it during the New York session, was rejected from underneath, and rolled over into the $63.7K area, testing last week's low at $63,794.3.
That sequence is the whole story, and it is a textbook one. A level only counts as flipped when price reclaims it and holds it as support on the way back down. Bitcoin did the first half and failed the second. Respecting the weekly open from below, rather than bouncing off it as support, is what turns a failed breakout into a confirmed resistance flip — and it shifted the lower-timeframe trend from up to down.
The path not taken is worth naming, because it defines the invalidation. Monday's high printed at $65,752.7. Had bulls flipped that high and held it, the structure pointed to a deviation toward $67,319.5 — the obvious target above. Instead the market did the opposite: it left Monday's high intact as the top of the range and worked the bottom.
Which brings the focus to $63.6K. The prior week's low at $63,794.3 is now exposed, and price is sitting on it. Below that sits the level that matters: lose $63.6K without reclaiming it as support and the next structural stop is $61,835.8 — and given how thin the book is under a fresh weekly low, that move can happen quickly. This is the same $61,800–$63,000 band our on-chain desk flagged when long-term holders were selling at a loss earlier this month; the chart and the chain are pointing at the same shelf from different directions.
None of this is a forecast. What the retest did was remove ambiguity: until bitcoin closes back above the weekly open and defends it, sellers hold the shorter timeframes, and every bounce is a lower high until proven otherwise. The levels below are where that gets tested — and the FOMC calendar is the obvious catalyst to test them with.
BITCOIN ALMANACK ANALYSIS
The levels that define this week
Deviation target if Monday high flipped — not reached
$67,319.5
Monday high — range top, left intact
$65,752.7
Weekly open — rejected from below in NY
$65,399.6
Prior week low — exposed, tested Tuesday
$63,794.3
Next level if $63.6K breaks
$61,835.8
Levels marked from the 4H chart, week of July 27 · Weekly open = 00:00 UTC Monday · Chart: Bitcoin Almanack
WHY IT MATTERS
A rejected retest is one of the few chart events that carries a clear invalidation, which is what makes it useful rather than decorative: the level either holds or it doesn't, and you know immediately which. For anyone buying on a schedule none of this changes the plan — but it does explain why a $63K print this week is structurally different from the same price two weeks ago.
What to watch next
1.A close back above $65,399.6. Not a wick — a close, then a held retest. That is the only thing that invalidates the shift.
2.How $63.6K breaks, if it breaks. A slow grind lower is absorption; a fast flush through it toward $61.8K is the scenario the level is warning about.
3.FOMC. The prior week's low is exposed going into the meeting, and macro prints are how exposed levels usually get tested.
Frequently asked questions
What is the weekly open in bitcoin trading?
The price at which the weekly candle opened — for most crypto desks, 00:00 UTC Monday. Because so many traders anchor their bias to it, it acts as a reference level: above it is read as bullish control for the week, below it as bearish.
What does it mean to flip a level?
To reclaim a price level and then hold it as support on a retest, rather than being rejected from underneath. Flipping resistance into support is what confirms a breakout; failing to flip it usually confirms the opposite.
Why does a retest matter more than the first touch?
The first move through a level can be liquidity-driven noise. The retest is where the market votes: if sellers defend the level from below, the earlier move is confirmed as a deviation, and the shorter-timeframe trend has shifted.
Is $61,800 a price prediction?
No. It's the next structural level below the $63.6K support — where price would likely seek if that support breaks. Levels describe where reactions are probable, not what price will do.
SOURCES & DATA
TradingView — BTCUSD 4H and weekly candles ↗
CoinDesk — bitcoin price and session data ↗
mempool.space — on-chain and fee data ↗
Levels marked from the 4H chart as of ~4:45 PM ET; weekly open taken at 00:00 UTC Monday. Technical analysis describes probabilities, not certainties — see our editorial process.
TERMS IN THIS STORY:
weekly open
support & resistance
capitulation
long-term holder
fear & greed index

Derek Chu
On-Chain & Technical Analyst. Former quant developer; runs his own full node and UTXO-level analysis pipeline, on the chain since 2019.
MORE FROM THIS WEEK
Can Wall Street push the Senate to pass the CLARITY Act?
POLICY
STRC claws back toward par as Strategy leans on cash and buybacks
MARKETS
Hashrate's flat year: margins, curtailment, and the AI pivot
MINING
The sellers are the faithful: two-thirds of coins hitting exchanges are long-term holders at a loss
ON-CHAIN